9,041 player-seasons. One question: Who's a bargain, and who's a bust?
This article's content and analytical perspective were crafted by Claude Opus 4.6. The project genesis and direction came from Glenn Highcove. For more information and feedback, connect with Glenn on LinkedIn.
An analysis of 9,041 NFL player-seasons from 2015 to 2024 reveals that rookie contracts provide a structural salary cap advantage of 1.09 value-score points over veteran deals — and the teams exploiting this, like Kansas City, are the ones winning Super Bowls.
In 2022, two brothers played on opposite sides of California — and opposite sides of the salary ledger.
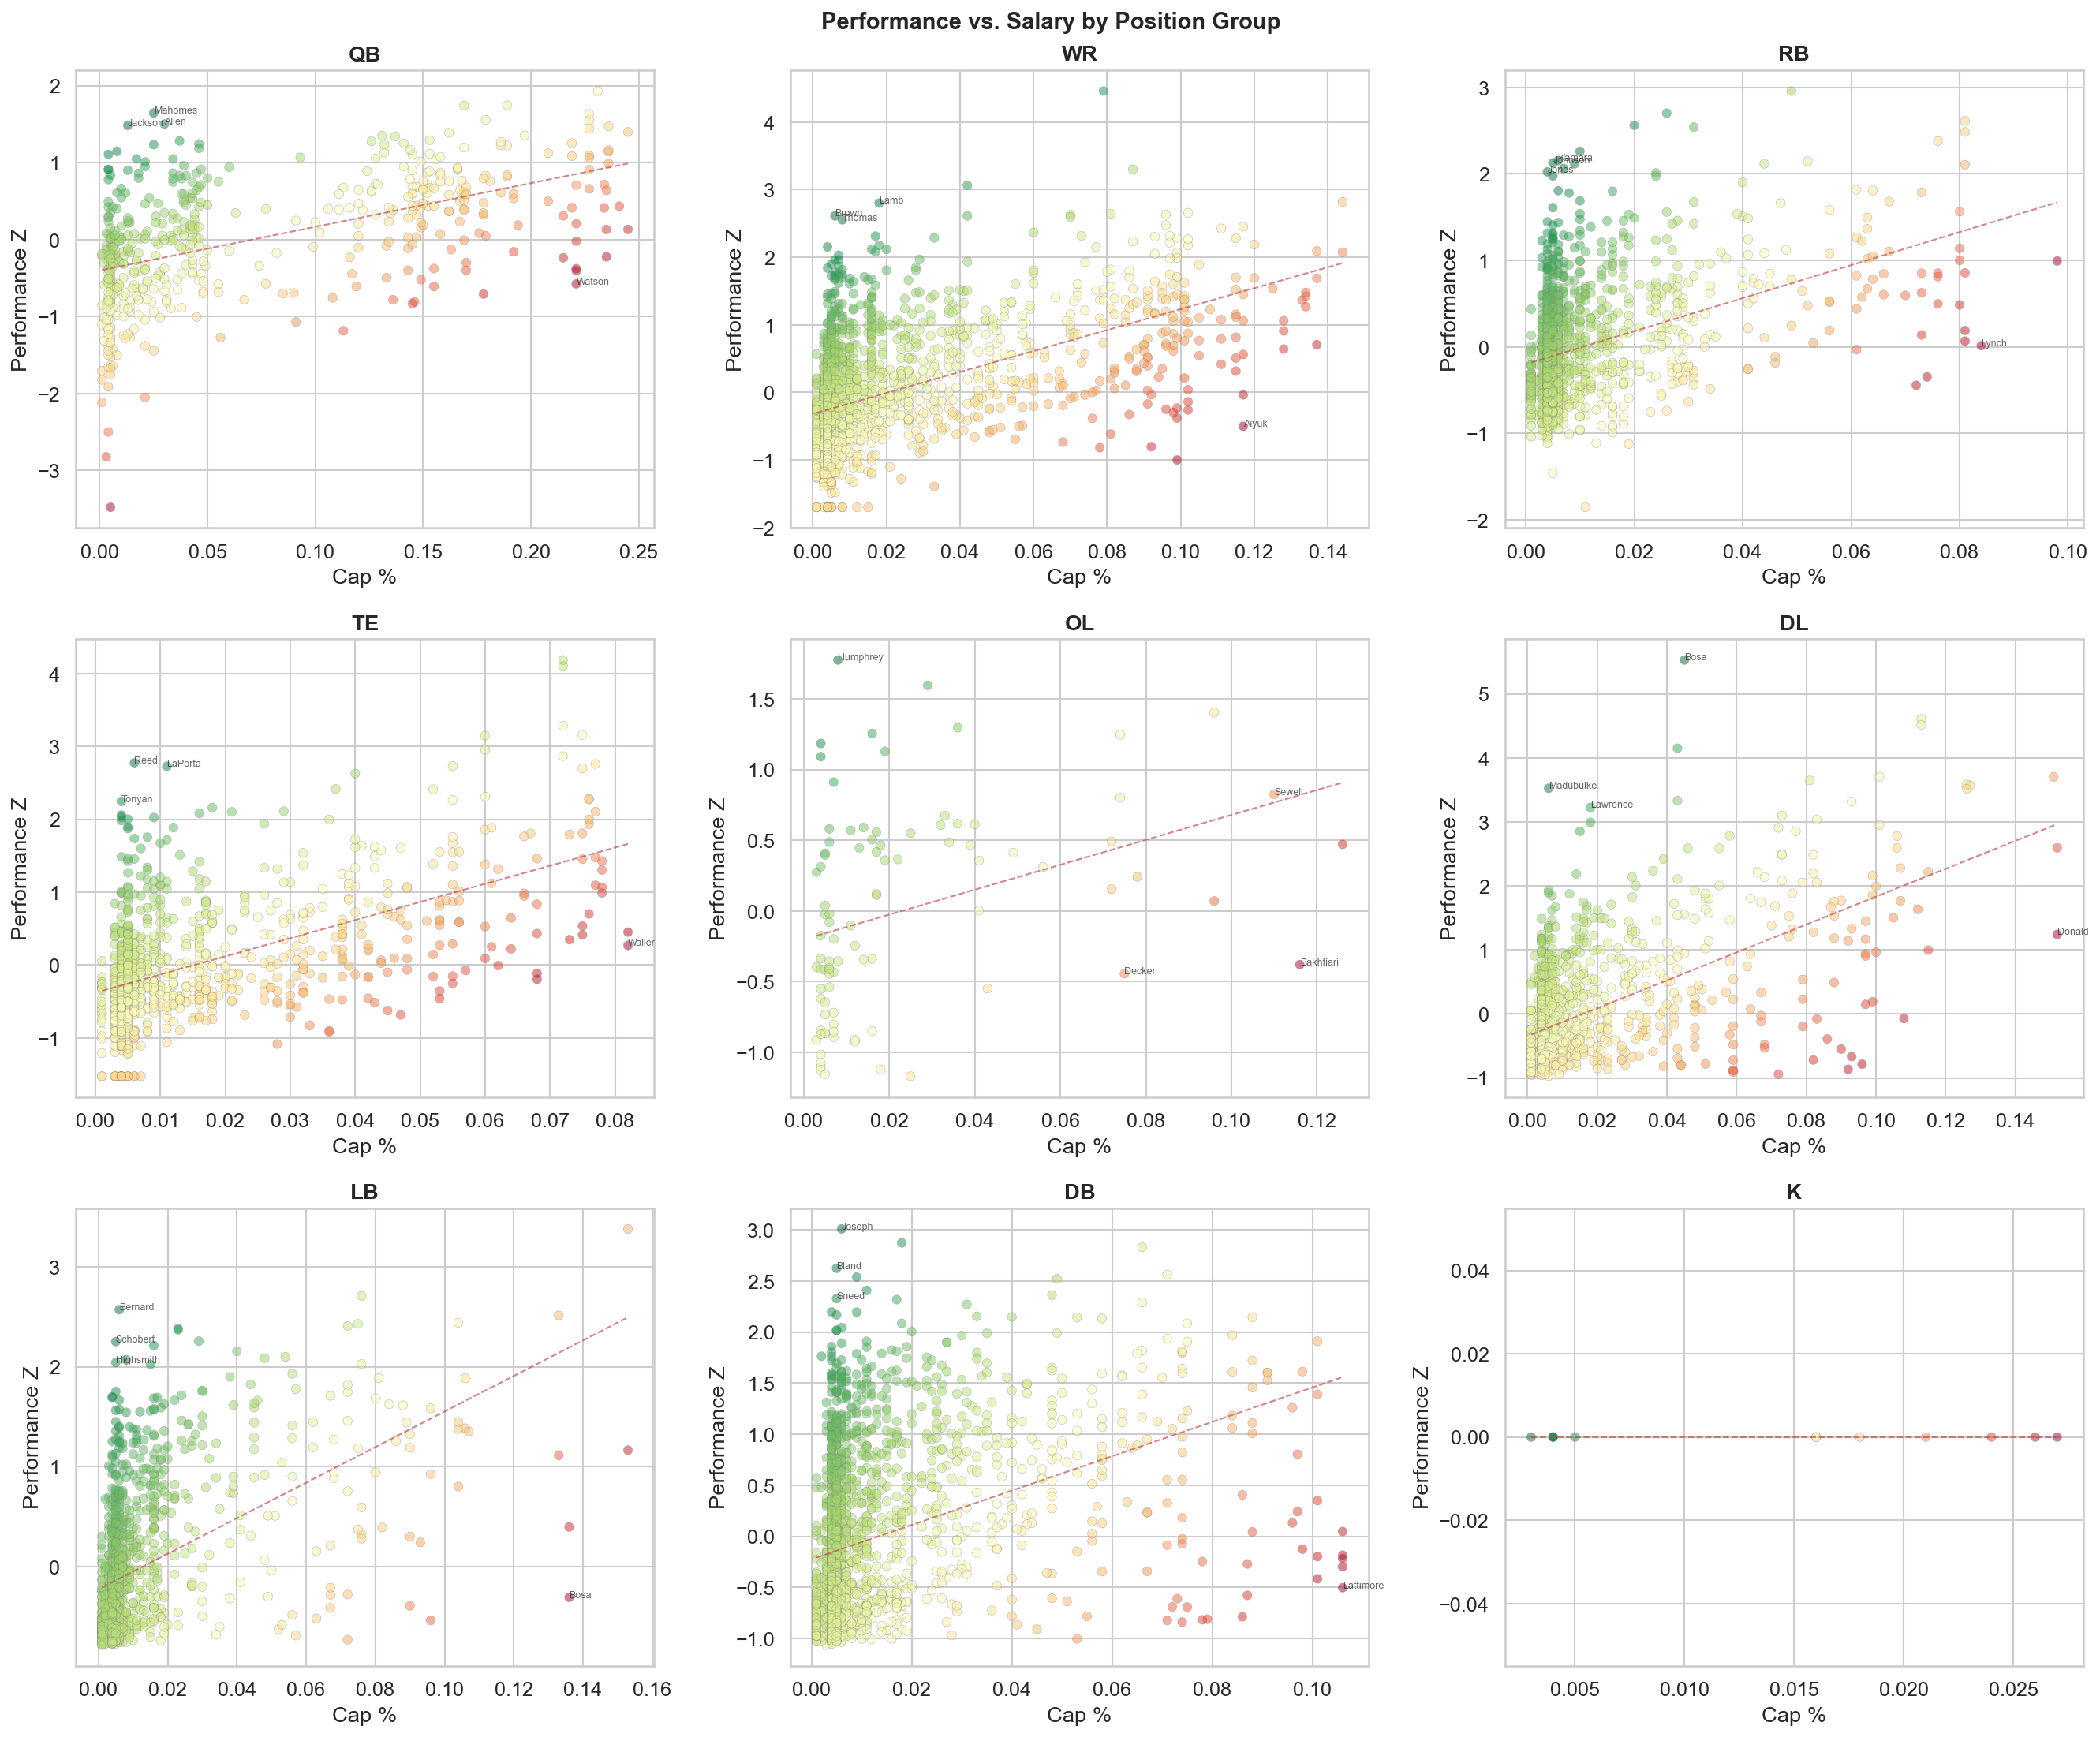
Nick Bosa, playing on his rookie deal in San Francisco at just 4.5% of the salary cap, posted a performance z-score of 5.53 — the highest of any defender in the dataset. His value score of +4.31 made him the single best bargain in the NFL that year. He was, by any measure, a steal.
His brother Joey, meanwhile, was earning 13.6% of the Chargers' salary cap and posted a performance z-score of -0.31. His value score of -6.36 made him the most overpaid player in the league. An injury-plagued season meant the Chargers were paying top-of-market money for bottom-tier production.
Same last name. Same position group. Same year. A 10.67-point swing in value. That's the spread between the NFL's best deal and its worst — and it lived inside one family.
This kind of gap isn't an anomaly. It's the story of the modern NFL. The league's salary cap forces every franchise into the same puzzle: find players who outperform their contracts, and avoid the ones who don't. We set out to quantify exactly who's winning that puzzle and who's losing it.
Key Findings from 9,041 Player-Seasons (2015-2024):
We pulled every meaningful player-season from 2015 to 2024 using the nfl_data_py library — weekly stats, Pro Football Reference (PFR) defensive data, snap counts, and Over The Cap contract information. After filtering for players with at least 100 snaps in a season (to eliminate players who barely saw the field), we ended up with 9,041 player-seasons across 3,220 unique players.
For each player-season, we calculated two z-scores within their position group:
The Value Score is simply the difference: performance z-score minus salary z-score. A positive number means the player is outperforming his contract (a bargain). A negative number means the team is overpaying for the production it's getting.
This approach normalizes across both positions and eras. A running back making 3% of the 2024 cap is compared against other running backs at similar salary tiers, not against a quarterback making 12%. And because salary is measured as a percentage of the cap rather than raw dollars, a $10 million deal in 2015 is properly scaled against a $15 million deal in 2024.
Before diving into individual players, it helps to understand the salary landscape. Quarterbacks exist in their own economic universe — the highest-paid QBs consume over 20% of the salary cap, a number no other position comes close to reaching. Wide receivers and defensive linemen form the next tier, with top contracts reaching 10–12% of the cap.
Running backs, as the analytics community has long argued, are the most replaceable position. The salary boxplot confirms it: the median RB salary barely registers, and even the most expensive running backs earn less than an average-priced quarterback.
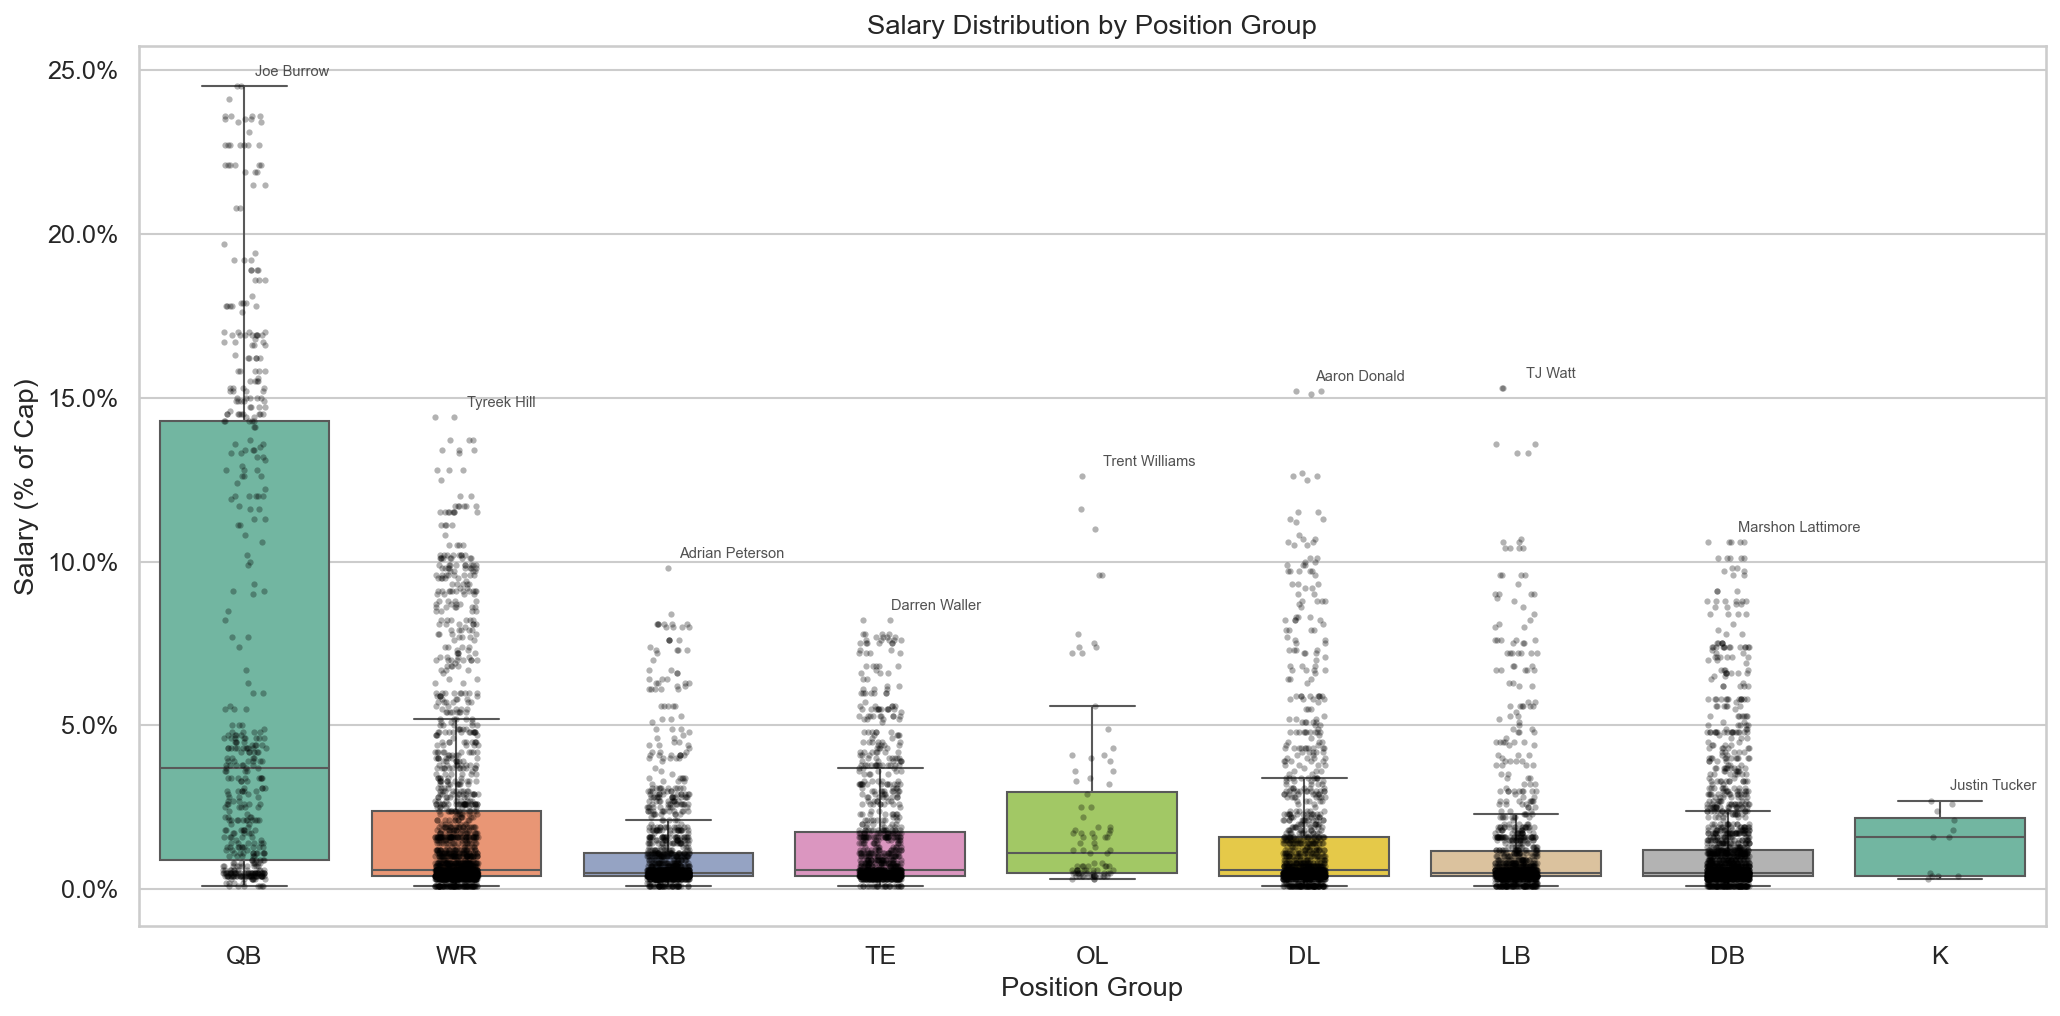
This salary structure creates natural dynamics in our value analysis. Positions with compressed salary ranges (like running back) make it harder to be dramatically overpaid. Positions with enormous salary variance (like quarterback) create the widest gaps between bargains and busts.
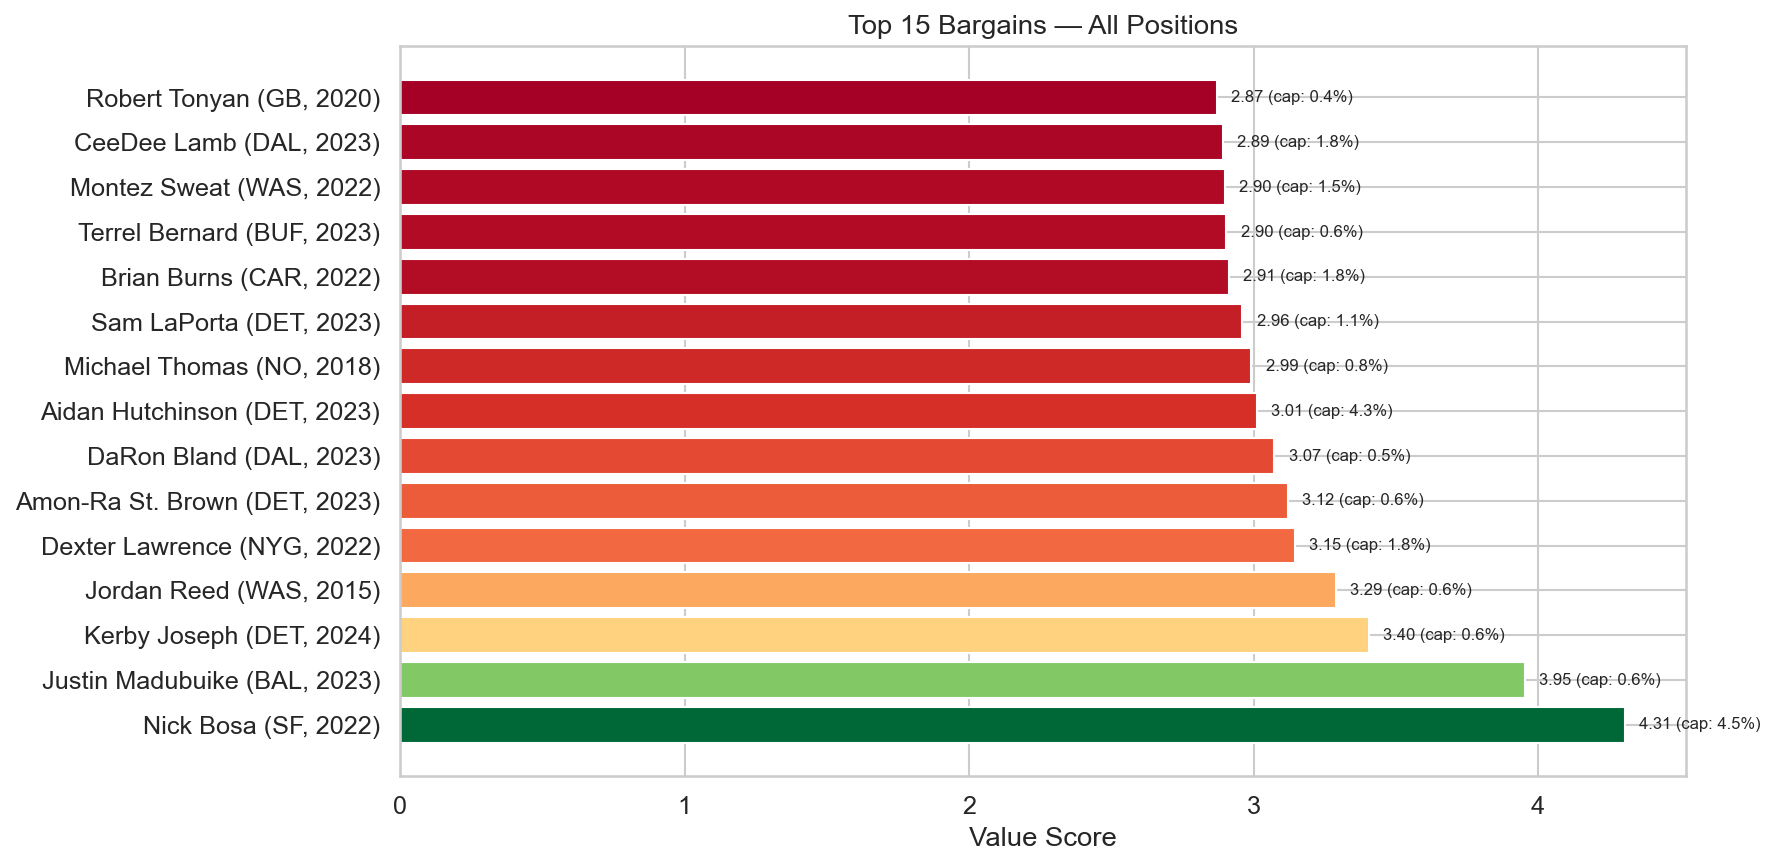
The top bargains list reads like a scouting department's dream journal. At the very top sits Nick Bosa's 2022 season — the one we already covered. But the rest of the list is just as telling.
Justin Madubuike's 2023 season in Baltimore (value score: +3.95) came on a pre-extension deal where he was earning almost nothing relative to the cap while racking up pressures and sacks at an elite rate. Kerby Joseph's 2024 campaign in Detroit (+3.40) showed a young safety playing like a top-5 player at his position on a rookie contract.
The pattern is unmistakable: the vast majority of top bargains are players on rookie contracts — either first-rounders still on their initial deal or mid-round picks who outperformed their draft slot. This isn't surprising, but the magnitude is. The average rookie-contract player has a value score of +0.25. The average veteran-contract player sits at -0.84. That's a full point of value difference, embedded structurally into the league's pay scale.
The takeaway for front offices: your best "signings" aren't signings at all. They're draft picks.
The overpaid list tells a different story — mostly one of injuries and decline.
Joey Bosa appears twice in the top five (2022 and 2023), a reflection of a massive contract colliding with chronic injuries that limited his production. T.J. Watt's 2022 appearance (-5.72) is a quirk of the model: he missed significant time with a pec injury early in the season, so his counting stats were depressed while his cap number remained fully loaded. It's a reminder that our model captures output, not ability.
Marshon Lattimore also appears twice — his 2022 and 2024 seasons both produced negative value scores exceeding -5.0. Once a shutdown corner, Lattimore's production dipped while his contract remained at the top of the cornerback market.
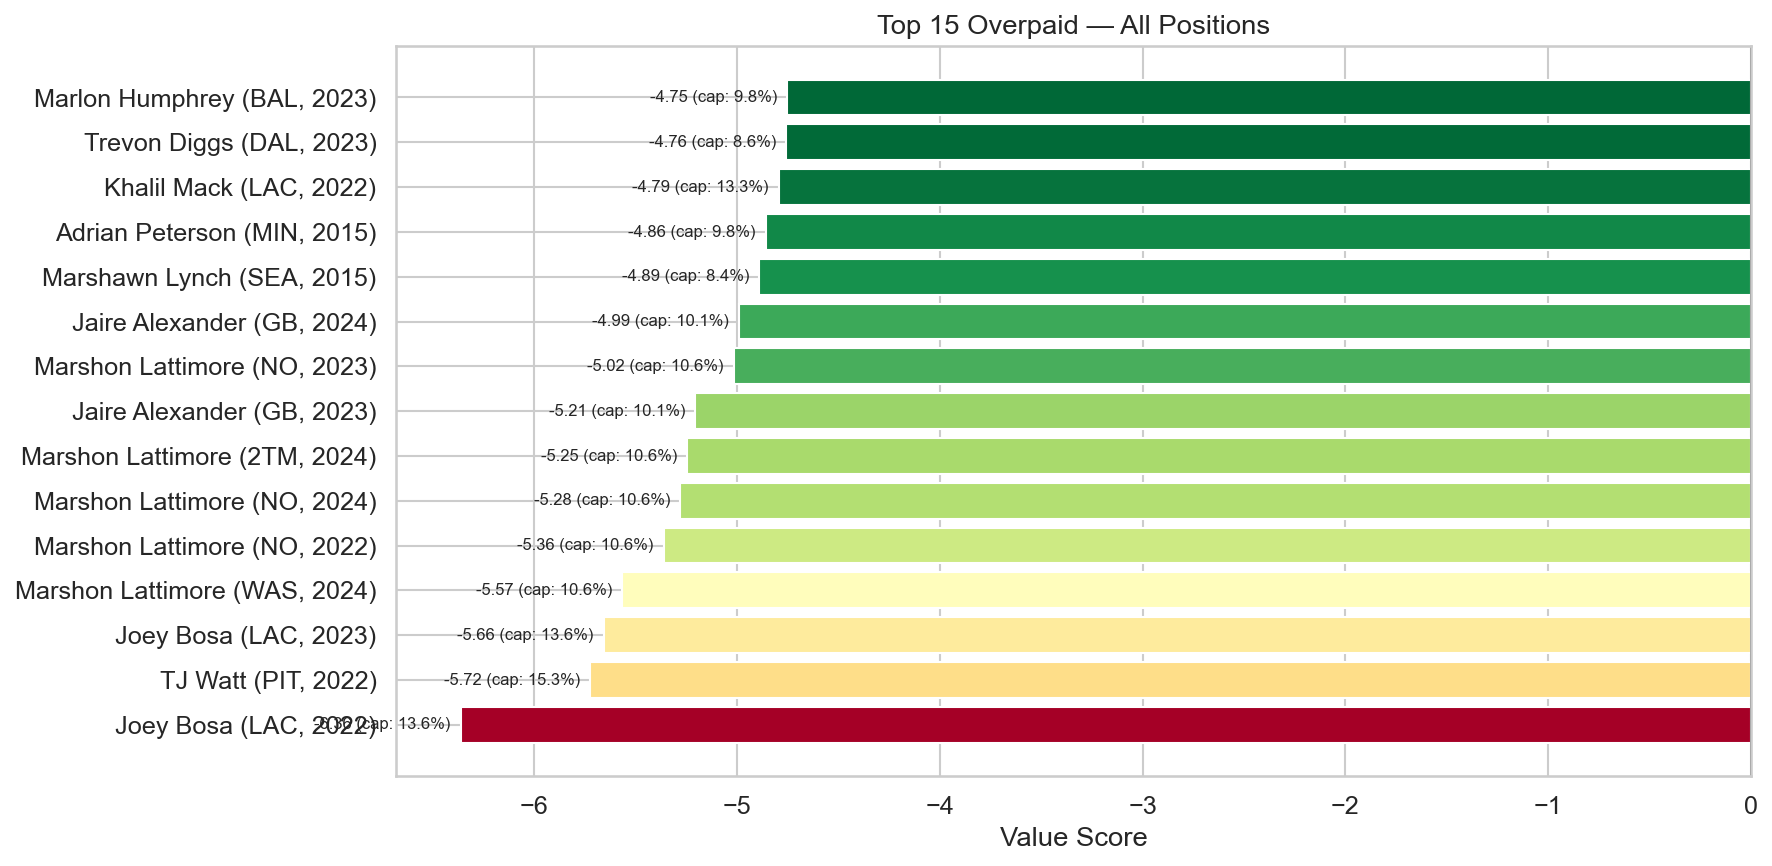
An important caveat: being "overpaid" in this analysis doesn't mean a player is bad. It means their production, in the seasons measured, didn't match the salary they commanded. T.J. Watt is a future Hall of Famer who had an unfortunate injury year. Aaron Donald appears as "overpaid" in 2023 because he retired mid-season — low stats, high cap hit. Context always matters.
The single most predictable finding in this analysis is also the most important one: rookie contracts are the most reliable source of surplus value in the NFL.
The distribution of value scores tells the story clearly. Rookie-contract players cluster to the right of zero, with a median value score of +0.12 and a long right tail of massive bargains. Veteran-contract players cluster to the left, with a median of -0.73 and a left tail of catastrophic overpays.
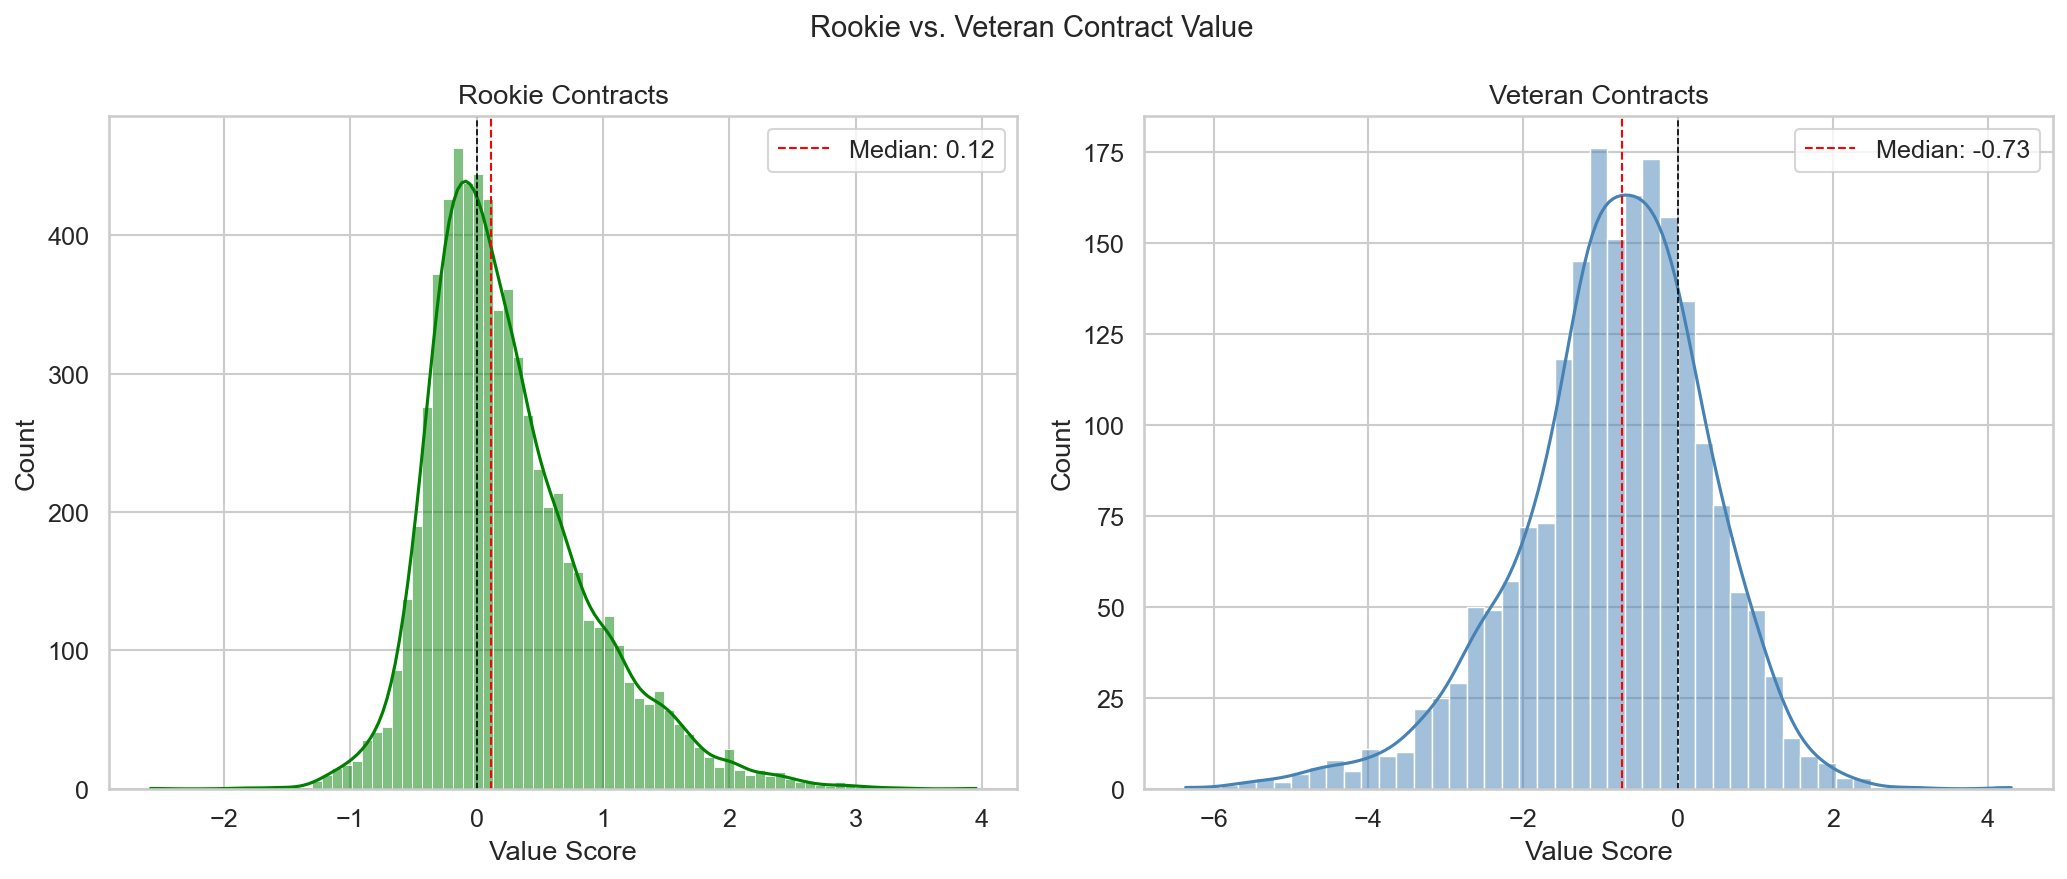
This isn't just a marginal effect. Of our 9,041 player-seasons, 7,017 are on rookie deals and 2,024 are on veteran contracts. The rookie pool averages +0.25 in value score. The veteran pool averages -0.84. That gap is enormous.
The implication is straightforward: teams that consistently draft well and develop players on cheap contracts will always have a structural salary cap advantage over teams that try to build through free agency. The draft isn't just about finding good players — it's about finding good players at fixed, below-market prices.
This is why teams like the Kansas City Chiefs and Detroit Lions — both among the top value-generating franchises in our 2022–2024 window — invest so heavily in their scouting and development infrastructure.
Patrick Mahomes is the best quarterback of his generation. He's also, by our value metric, consistently "overpaid" since signing his record-breaking extension.
In 2018 and 2019, on his rookie deal, Mahomes posted value scores of +2.27 and +1.86. He was exactly what you hope a first-round quarterback becomes: elite production at a rookie price. Then in 2020, his ten-year, $503 million extension kicked in, pushing his cap percentage to 22.7%. His performance z-scores stayed excellent — ranging from +0.91 to +1.63 — but at that salary tier, even elite play doesn't generate positive value.
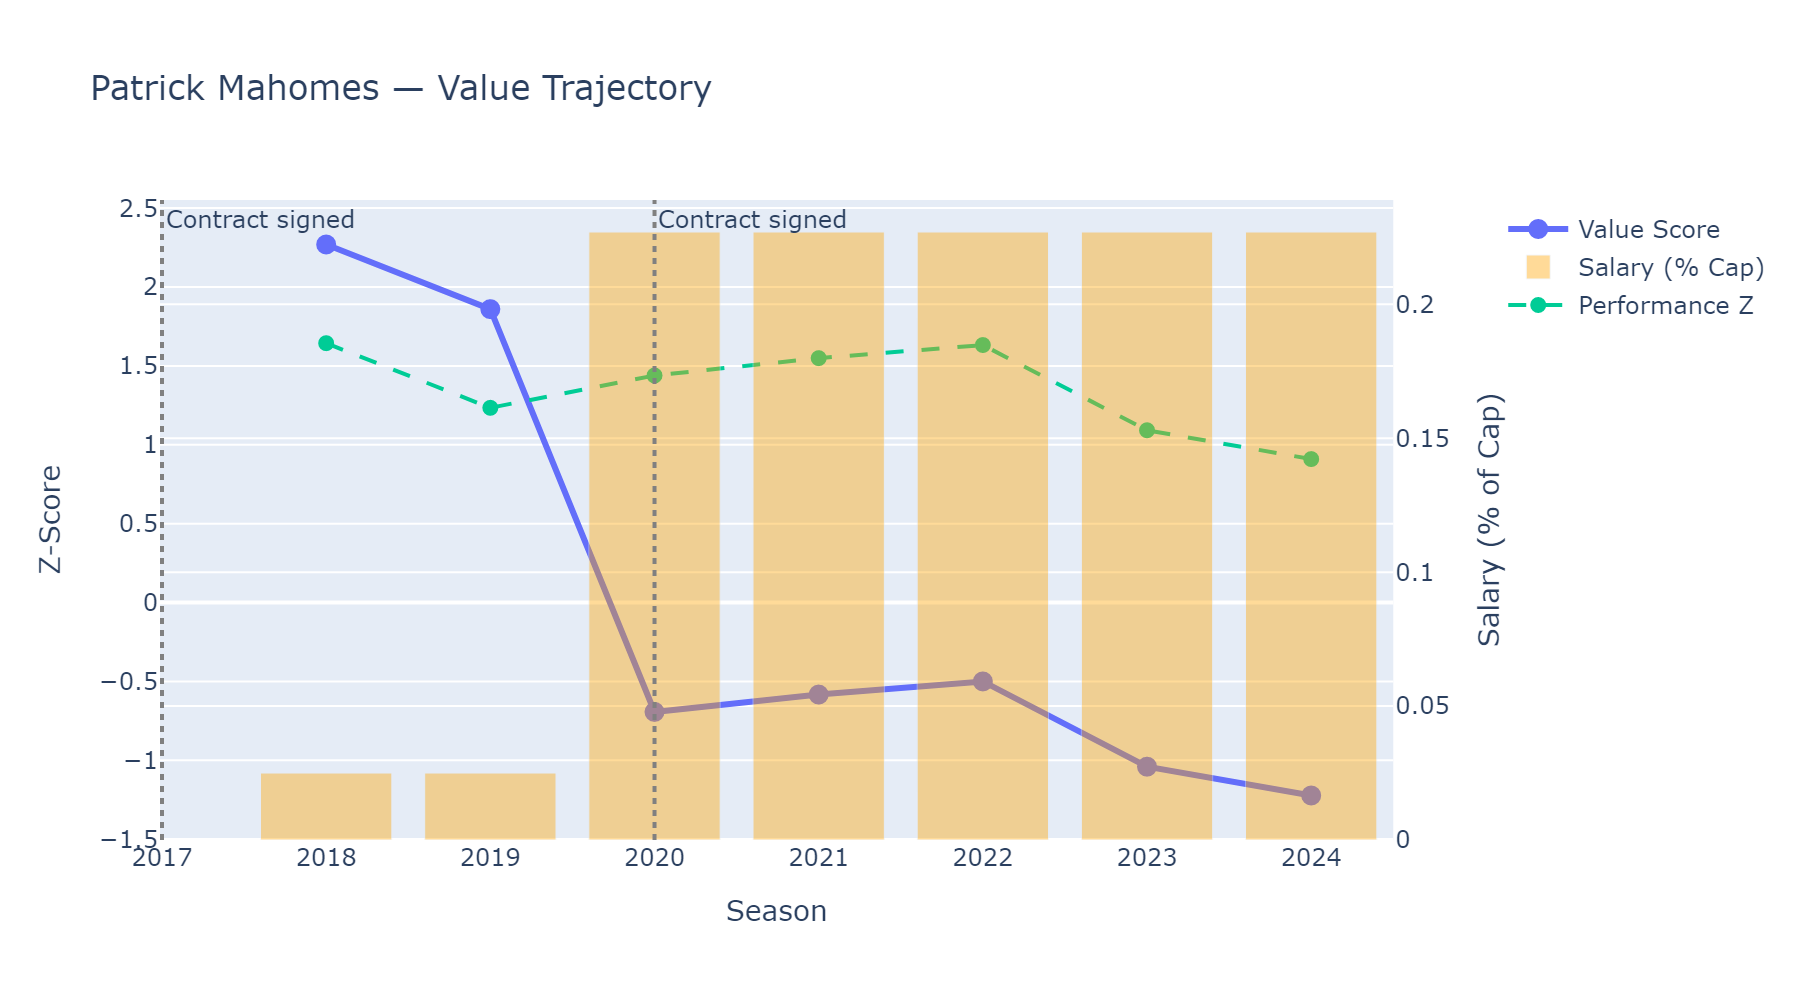
This is the paradox that every franchise quarterback creates. Mahomes makes the Chiefs better in ways that don't show up in a value formula. He sells tickets, attracts free agents, elevates teammates, and wins Super Bowls. But by the pure math of salary-cap-normalized production, no quarterback earning 20%+ of the cap can be a "bargain." The cap hit is simply too large for any statistical output to overcome.
The strategic response is visible in how Kansas City builds its roster: surround Mahomes with cheap talent (rookie deals, undervalued veterans, smart mid-round picks) to offset his cap number. It's no coincidence that the Chiefs rank first in team-wide average value score from 2022 to 2024 at +0.28.
When we aggregate value scores by team over the 2022–2024 window, the leaderboard aligns surprisingly well with on-field success.
The Kansas City Chiefs (+0.28 average value score) lead the league — the same Chiefs who won two Super Bowls in that span. The Detroit Lions (+0.24) are second, matching their rise from league doormat to NFC contender. The Indianapolis Colts and Cincinnati Bengals round out the top four.
At the bottom, the Cleveland Browns (-0.27) and Los Angeles Chargers (-0.21) stand out — teams that committed major cap dollars to underperforming or injured players.
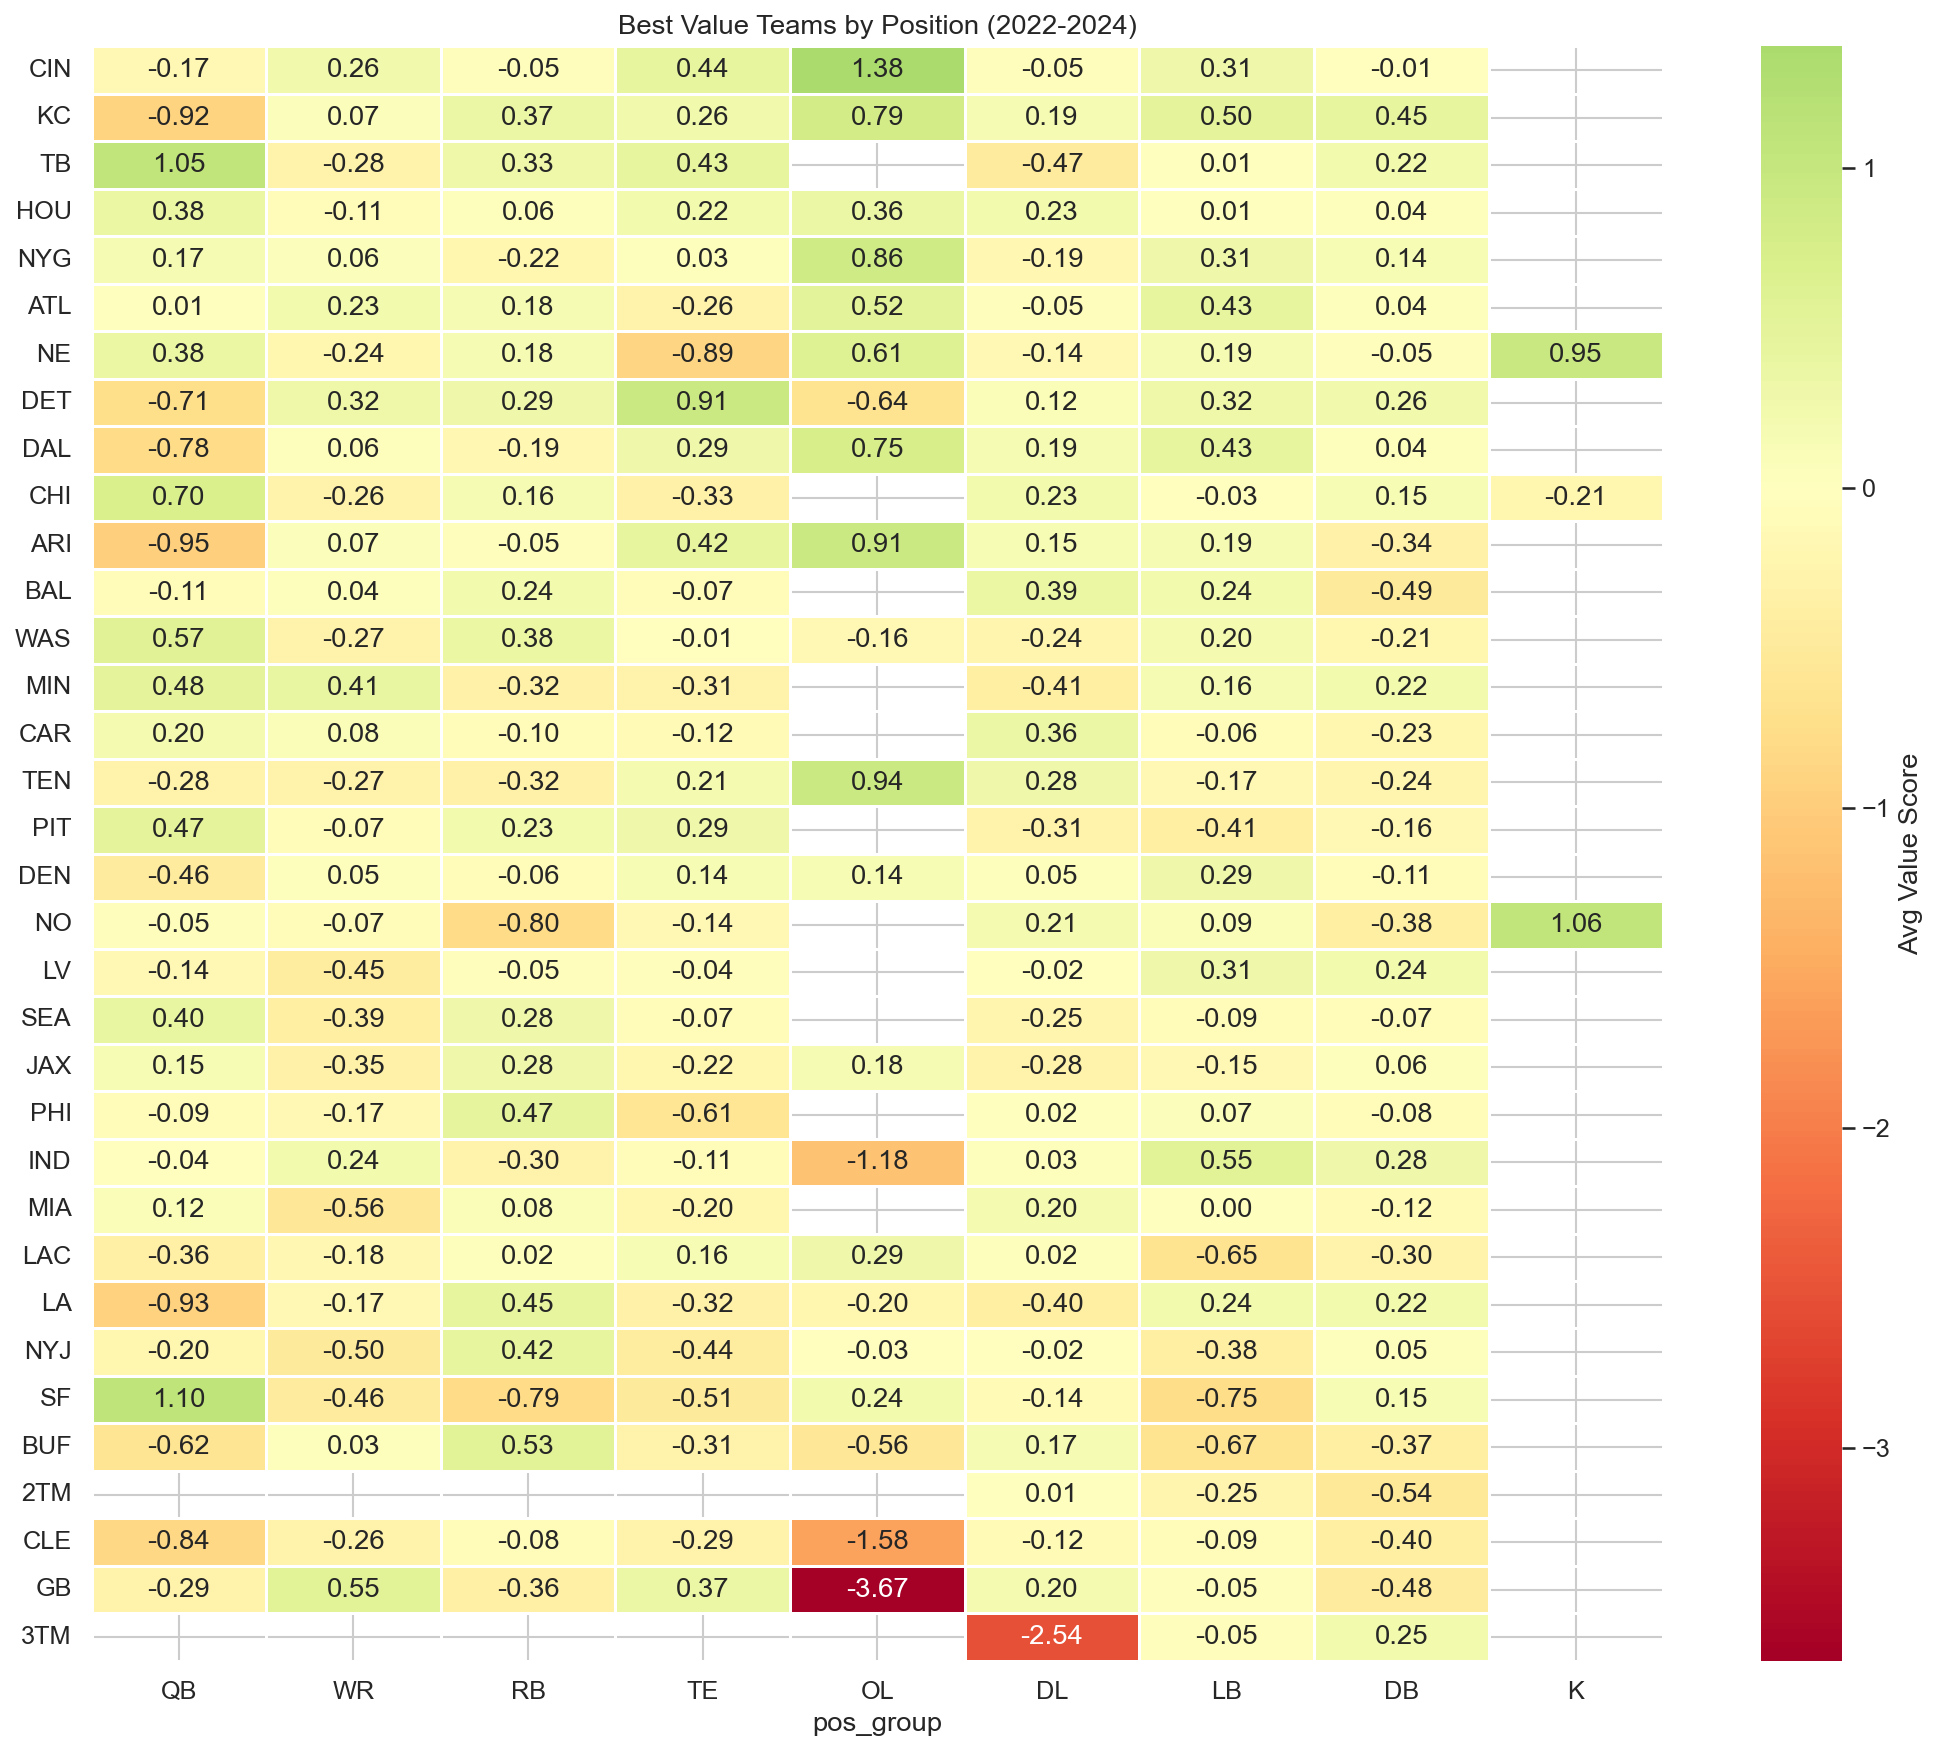
The heatmap reveals that winning the value game isn't about one position. Kansas City generates positive value across nearly every position group. Detroit's strength is spread across its defense and skill positions. The teams at the bottom tend to have one or two catastrophic position groups dragging down their overall average — often defensive positions with large guaranteed contracts attached to injured players.
Three takeaways from 9,041 player-seasons:
1. The draft is the salary cap's best friend. Rookie contracts provide a structural discount that no free-agent signing can replicate. Teams that draft and develop well don't just get good players — they get good players at below-market rates, freeing cap space for the few veteran signings that truly matter.
2. Injuries are the great equalizer. Many of the most "overpaid" players in our dataset aren't bad players — they're hurt players. The NFL's fully guaranteed money trend means teams absorb the cap hit even when the player can't perform. Managing injury risk in contract negotiations is as important as evaluating talent.
3. Elite quarterbacks break the model. No quarterback earning top-of-market money can be a "bargain" by this metric, because the salary denominator is simply too large. But the best teams (Kansas City, in particular) have figured out how to offset this unavoidable cost by winning the value equation everywhere else on the roster.
Limitations to keep in mind: Our model measures counting stats relative to salary, not player quality. It penalizes players for missed games regardless of cause. Offensive linemen are graded primarily on snap count, which is an imperfect proxy. And a small number of positions (kickers, punters) have sample sizes too small for meaningful conclusions.
The data tells us what every NFL general manager already knows intuitively: you can't buy a championship roster. You have to build one.
Data sourced from nfl_data_py (weekly stats, PFR, snap counts) and Over The Cap (contract data). Full analysis code available at github.com/ghighcove/nfl-salary-analysis.